Debunking the Climate Scam
Billions of Dollars -
Greedy Green Corporations -
No Warming For Two decades -
Bought and Paid For Organizations
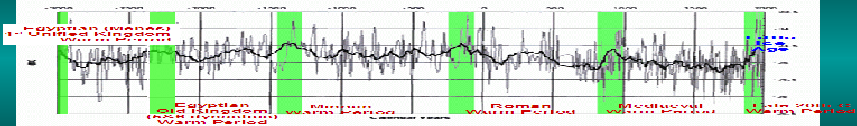
5000 Years Of Climate Change From Greenland Ice Cores
This NASA graph shows arctic temperature from about 1900 to 2000.
Two periods of warming are shown: 1917 to 1937 and 1979 to 2000.
1st warming started with man’s CO2 emissions at 955 MT(1) in 1917 and ended with man’s CO2 emissions at 1209 MT(1) in 1937.
2nd warming started with man’s CO2 emissions at 5369 MT(1) in 1979 and ended with man’s CO2 emissions at 6765 MT(1) in 2000.
The fact that the later warming was slower and less severe with more of man’s CO2 shows that more CO2 did not cause more warming. This is also an example of NASA deceiving us since they paint a scary picture of recent warming, but ignore earlier, faster warming that occurred with far less of man’s CO2 emission.
NASA graph: http://earthobservatory.nasa.gov/Features/ArcticIce/arctic_ice3.php
Emissions from http://cdiac.ornl.gov/ftp/ndp030/global.1751_2010.ems
(1) MT = Annual metric tons of carbon emission -
Compelling Evidence That Increased CO2
Did Not Cause Increased Arctic Temperature
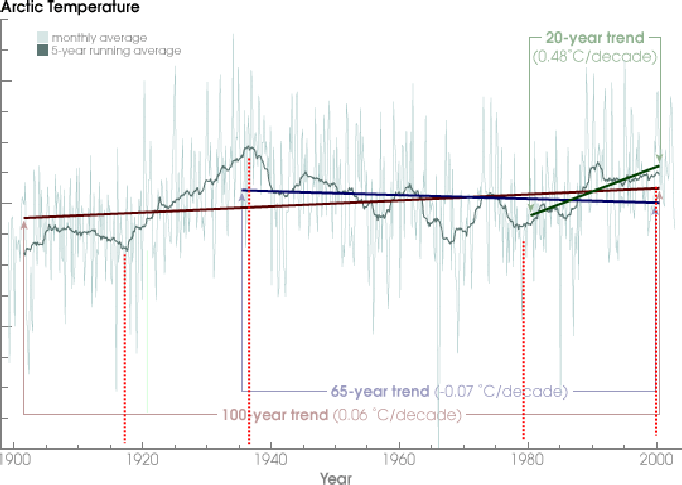
Graph from NASA web page titled “Evidence of Arctic Warming”:
(http://earthobservatory.nasa.gov/Features/ArcticIce/arctic_ice3.php)
(Items in Red added to show dates and CO2 emissions)
Emissions from http://cdiac.ornl.gov/ftp/ndp030/global.1751_2010.ems
MT = Annual metric tons of carbon emission -
Man’s emissions=
955 MT
Man’s emissions=
1209 MT
Man’s emissions=
5369 MT
Man’s emissions=
6765
MT
NASA graph of arctic temperature shows that MORE of Man’s CO2 DID NOT cause more warming.
This is because the later warming was slower and less severe with MORE man’s CO2, than the earlier warming which was faster and more severe with less of man’s CO2.

More of man’s CO2
less warming and slower ![]()
| Warming Stopped |
| NOAA Data |
| NorthWest |
| Oregon |
| Washington |
| Extreme Weather |
| Past Was Warmer |
| NASA: 30's Hotter |
| HistoryOFAlarmism |
| Central England |
| Temperature History |
| MultiProxy |
| treemometers |
| Northwest Passage |
| Acidification-Ball |
| Acidification-Fulks |
| Acidification-Idso |
| Selected Emails |
| CRU Emails - html formatted |
| CRU Emails Simple Format |
| CRU Emails UnFormatted |
| DCPS paper |
| CRU_Files_Notice |
| False Deadlines |
| Hockey Stick Links |