Debunking the Climate Scam
Billions of Dollars -
Greedy Green Corporations -
No Warming For Two decades -
Bought and Paid For Organizations
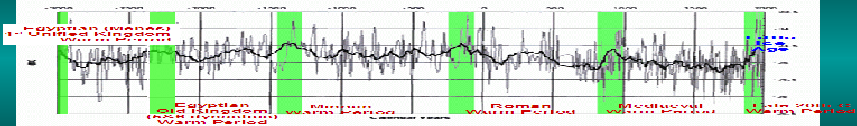
5000 Years Of Climate Change From Greenland Ice Cores

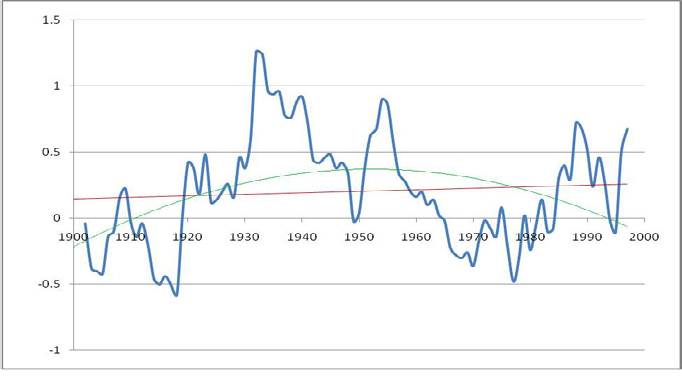
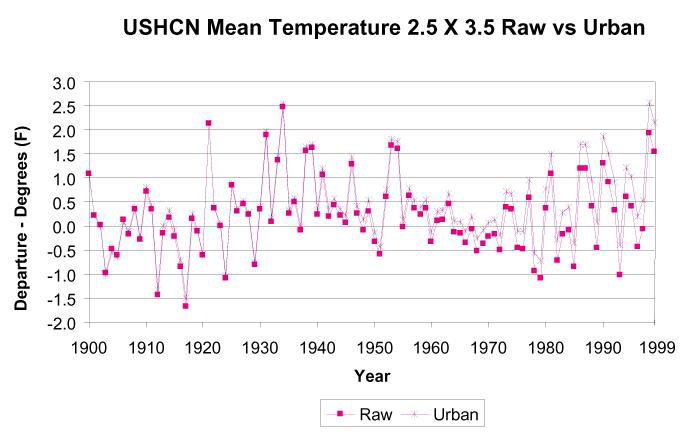
This chart from http://cdiac.ornl.gov/epubs/ndp/ushcn/ts.ushcn_anom25_diffs_urb-
This chart has been removed from the above source, but was saved at:
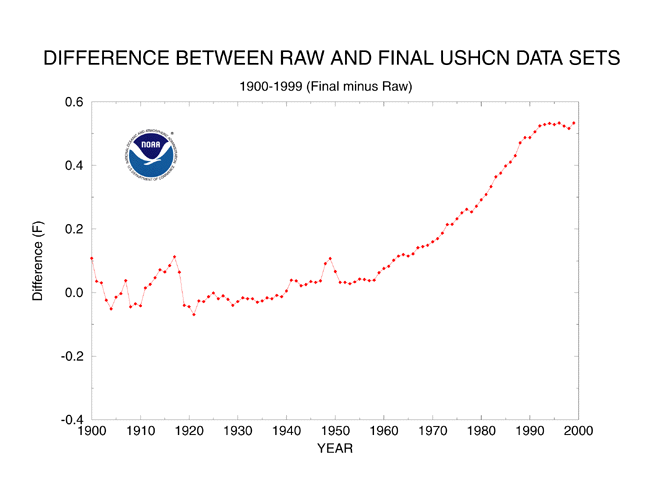
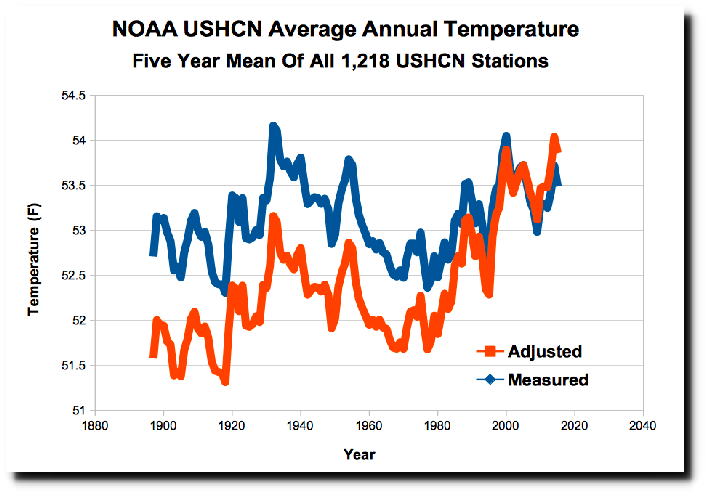
“Adjustments” to the original data readings are large –
So large that unadjusted data shows cooling.
Temperature anomaly profile from NASA GISS after adjustments removed = Unadjusted data (Raw data)
IMPORTANT––> The Completely Fake Time Of Observation Bias (local)
Below is from:
http://jennifermarohasy.com/blog/2009/06/how-
Here is the official explanation of the adjustments: http://cdiac.ornl.gov/epubs/ndp/ushcn/ndp019.html (Local)
If The Data Doesn’t Match The Theory – Change The Data
Long term stations show NO WARMING before “adjustments”

Figure 3: Temperature trends and station counts for all US stations in GISS reporting
continuously, that is containing at least one monthly data point for each year from
1900 to 2000. The slope for the rural stations (335 total) is -
(graph from: https://realclimatescience.com/2018/03/noaa-
Raw NOAA Data Adjusted NOAA Data
IMPORTANT––> The Completely Fake Time Of Observation Bias (local)
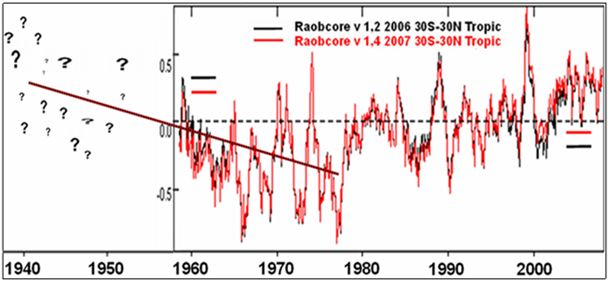
The mystery deepens — where did that decline go?
From: http://joannenova.com.au/2010/03/the-
Frank Lansner has done some excellent follow-
The most mysterious period is from 1958 to 1978, when a steep 0.3C decline that was initially recorded in the Northern Hemisphere. Years later that was reduced so far it became a mild warming, against the detailed corroborating evidence from raobcore data.
Raobcore measurements are balloon measures. They started in 1958, twenty years before satellites. But when satellites began, the two different methods tie together very neatly–telling us that both of them are accurate, reliable tools.
You can see how similar the data from both methods is:
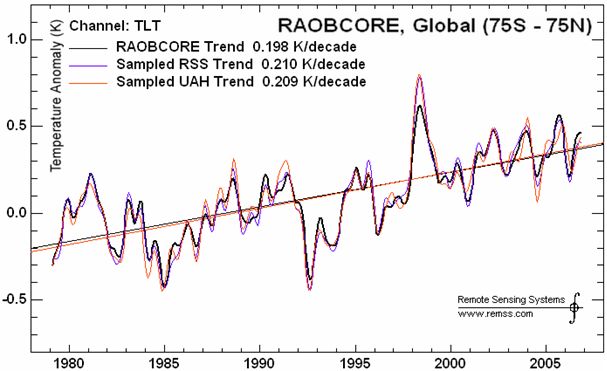
So what do the raobcores tell us about the period before satellites started recording
temperatures? They make it clear that temperatures fell quickly from 1960-
The decline in the original graph in National Geographic in 1976 is apparently backed up by highly accurate balloon data, and was based on peer reviewed data: Budyko 1969 and Angell and Korshover (1975). These two sets overlap from 1958 to 1960, and correlate well, so stitching them together is reasonable thing to do and it doesn’t make much difference which year is chosen from the overlap period (indeed any other choice makes the decline slightly steeper).
Read the rest at the source: From: http://joannenova.com.au/2010/03/the-
Massive Tampering With Temperatures In South America
IMPORTANT––> Balloon data shows 1940-
Temperature decline 1940-
where did that decline go? (local-
http://wattsupwiththat.com/2010/03/16/rewriting-
http://hidethedecline.eu/pages/posts/temperature-
http://hidethedecline.eu/pages/posts/temperature-
http://joannenova.com.au/2010/03/hiding-
peer reviewed data: Budyko 1969 and Angell and Korshover (1975) (links appear dead)
Blog post on Faked data (local)
| Warming Stopped |
| NOAA Data |
| NorthWest |
| Oregon |
| Washington |
| Extreme Weather |
| Past Was Warmer |
| NASA: 30's Hotter |
| PastBeliefs |
| HistoryOFAlarmism |
| Central England |
| Temperature History |
| MultiProxy |
| treemometers |
| Northwest Passage |
| Acidification-Ball |
| Acidification-Fulks |
| Acidification-Idso |
| Selected Emails |
| CRU Emails - html formatted |
| CRU Emails Simple Format |
| CRU Emails UnFormatted |
| DCPS paper |
| CRU_Files_Notice |
| False Deadlines |
| Hockey Stick Links |