Home Climate Facts Climate Briefs Alarmist Rebuttals Failed Predictions Historic News Clipings News Reports Russian Money How They Lie to YOU Its OK to Lie! CO2 Facts Warm Periods Lack Of Data Electricity Cost Climate Is Normal Heat/Cold Deaths Wild Fires Green New Deal No Rapid Waring Sun - Real Cause of Climate Alarmist errors C13/C12 Isotope Ratio oregon_climate_plan Tipping Points Climate Predictions IPCC Says Our Best Data 22 Inconvenient Truths Medieval Warm Period Extinctions Propaganda Fossil Fuel subsidies Who's Lying? What is Real Science Peer Review Adjustment Example proxies Climate Papers Debunking Claims NASA Debunk Antarctic Loss Renewables Corals Trillion Dollar Industry Big Money Scaring green money Paid by fossil fuel Warming Stopped Media Lies People are Dying History (politics) Extreme Weather? Its Warming,But Acidification IPCC_Flawed IPCC Prediction Fail IPCC_Disproved IPCC_PeerReview IPCC Scientists IPCC&CLouds WWF Infiltrated the IPCC Harming People misconduct Data Adjustments Major Data Tampering Cooling since 1945? Drought, hurricanes etc. Arctic History Selected Emails Selected Quotes Fraud Of Century? 97 percent of scientists 97% is meaningless 25% of AMS / 50% JonesInterview An OK Prediction Data Sources Record Temperature Energy Facts GridStorage CostlyEnergy Michael Mann Mann's Book Wegman on Mann paper styn_vs_mann Peer Review Error Statistical Errors The Sun Solar OceanHeat Ocean Heat Polar Bears OK AlGore's Errors Ask Questions Climate Models Record Highs Local Food Threats Why I'm a Skeptic GreenhouseMoon Alternative Energy 1350+ realist papers Conflict of Interest? Muzzeled Scientists How To Argue Common Ground Hurricane


Debunking the Climate Scam

Billions of Dollars -  Fudged Data  -  Corrupt Scientists

Greedy Green Corporations - Trillion Dollar Prize

No Warming For Two decades - Illiterate Media

Bought and Paid For Organizations


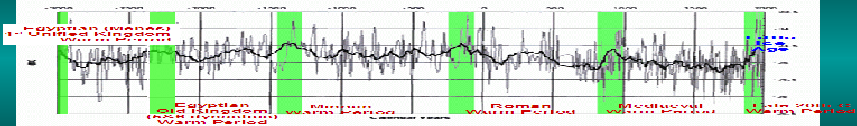
5000 Years Of Climate Change From Greenland Ice Cores

Figure: Global 24-month running sum time-series of Accumulated Cyclone Energy updated through March 12, 2009.


Very important: global hurricane activity includes the 80-90 tropical cyclones that develop around the world during a given calendar year, including the 12-15 that occur in the North Atlantic (Gulf of Mexico and Caribbean included). The heightened activity in the North Atlantic since 1995 is included in the data used to create this figure.


As previously reported here and here at Climate Audit, and chronicled at my Florida State Global Hurricane Update page, both Northern Hemisphere and overall Global hurricane activity has continued to sink to levels not seen since the 1970s. Even more astounding, when the Southern Hemisphere hurricane data is analyzed to create a global value, we see that Global Hurricane Energy has sunk to 30-year lows, at the least. Since hurricane intensity and detection data is problematic as one goes back in time, when reporting and observing practices were different than today, it is possible that we underestimated global hurricane energy during the 1970s. See notes at bottom to avoid terminology discombobulation.


Using a well-accepted metric called the Accumulated Cyclone Energy index or ACE for short (Bell and Chelliah 2006), which has been used by Klotzbach (2006) and Emanuel (2005) (PDI is analogous to ACE), and most recently by myself in Maue (2009), simple analysis shows that 24-month running sums of global ACE or hurricane energy have plummeted to levels not seen in 30 years. Why use 24-month running sums instead of simply yearly values? Since a primary driver of the Earth's climate from year to year is the El Nino Southern Oscillation (ENSO) acts on time scales on the order of 2-7 years, and the fact that the bulk of the Southern Hemisphere hurricane season occurs from October - March, a reasonable interpretation of global hurricane activity requires a better metric than simply calendar year totals. The 24-month running sums is analogous to the idea of "what have you done for me lately".


During the past 6 months, extending back to October of 2008 when the Southern Hemisphere tropical season was gearing up, global ACE had crashed due to two consecutive years of well-below average Northern Hemisphere hurricane activity. To avoid confusion, I am not specifically addressing the North Atlantic, which was above normal in 2008 (in terms of ACE), but the hemisphere (and or globe) as a whole. The North Atlantic only represents a 1/10 to 1/8 of global hurricane energy output on average but deservedly so demands disproportionate media attention due to the devastating societal impacts of recent major hurricane landfalls.


For the rest of the story:  http://www.climateaudit.org/?p=5449

(from http://www.climateaudit.org/?p=5449)

by ryanm on March 12th, 2009

Post by Ryan N. Maue, Florida State University COAPS  

Global hurricane activity has decreased to the lowest level in 30 years.


Global hurricane activity reaches new lows