Home Climate Facts Climate Briefs Alarmist Rebuttals Failed Predictions Historic News Clipings News Reports Russian Money How They Lie to YOU Its OK to Lie! CO2 Facts Warm Periods Lack Of Data Electricity Cost Climate Is Normal Heat/Cold Deaths Wild Fires Green New Deal No Rapid Waring Sun - Real Cause of Climate Alarmist errors C13/C12 Isotope Ratio oregon_climate_plan Tipping Points Climate Predictions IPCC Says Our Best Data 22 Inconvenient Truths Medieval Warm Period Extinctions Propaganda Fossil Fuel subsidies Who's Lying? What is Real Science Peer Review Adjustment Example proxies Climate Papers Debunking Claims NASA Debunk Antarctic Loss Renewables Corals Trillion Dollar Industry Big Money Scaring green money Paid by fossil fuel Warming Stopped Media Lies People are Dying History (politics) Extreme Weather? Its Warming,But Acidification IPCC_Flawed IPCC Prediction Fail IPCC_Disproved IPCC_PeerReview IPCC Scientists IPCC&CLouds WWF Infiltrated the IPCC Harming People misconduct Data Adjustments Major Data Tampering Cooling since 1945? Drought, hurricanes etc. Arctic History Selected Emails Selected Quotes Fraud Of Century? 97 percent of scientists 97% is meaningless 25% of AMS / 50% JonesInterview An OK Prediction Data Sources Record Temperature Energy Facts GridStorage CostlyEnergy Michael Mann Mann's Book Wegman on Mann paper styn_vs_mann Peer Review Error Statistical Errors The Sun Solar OceanHeat Ocean Heat Polar Bears OK AlGore's Errors Ask Questions Climate Models Record Highs Local Food Threats Why I'm a Skeptic GreenhouseMoon Alternative Energy 1350+ realist papers Conflict of Interest? Muzzeled Scientists How To Argue Common Ground Hurricane


Debunking the Climate Scam

Billions of Dollars -  Fudged Data  -  Corrupt Scientists

Greedy Green Corporations - Trillion Dollar Prize

No Warming For Two decades - Illiterate Media

Bought and Paid For Organizations


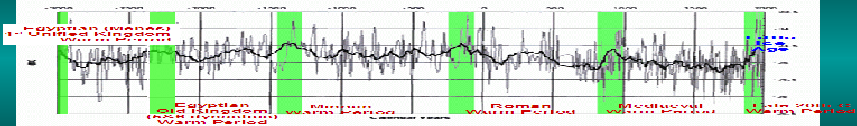
5000 Years Of Climate Change From Greenland Ice Cores

‘Hide The Decline’ Unveiled:

50 Non-Hockey Stick Graphs Quash Modern ‘Global’ Warming Claims

By Kenneth Richard on 27. September 2016


We are told the globe is rapidly and dangerously warming, and that this rapid and dangerous warming has been predominantly caused by the steep rise in anthropogenic CO2 emissions that began about the mid-1940s.


We even have a widely-recognized “hockey stick” graph of the Northern Hemisphere — created by Michael Mann in the late 1990s and popularized by the IPCC (2001) — to “prove” that modern warming has been synchronously global in scale, as well as rapid, dangerous, and perhaps even unprecedented (“the warmest on record”).


There is a problem with this paradigm, however.  An enormous problem.


That is, when scientists reconstruct sea surface temperatures (SST) and land surface temperatures and deep ocean heat content from the paleoclimate record (hundreds to thousands of years ago) using existing physical proxy evidence, and when they use this same physical evidence to reconstruct the modern temperatures, the rapid and dangerous warming trend that mysteriously forms a hockey stick shape for recent decades seems to just simply . . . disappear.  In its place is a modern record of temperatures from locations all over the world that looks like anything but a rapidly warming, dangerous, and unprecedented hockey stick.  Instead, the paleoclimate record reveals the opposite: large regions of the Earth were significantly warmer than they are now for most of the last several thousand years.


Below is a compilation of 50 temperature graphs from peer-reviewed scientific papers.  Some graphs indicate that (a) post-1940s temperatures actually declined slightly many regions of the world rather than rose rapidly — the opposite of what climate models had predicted.   All the graphs show that (b) modern (post-1940s) temperatures aren’t any warmer than the decades and centuries and millennia prior to the steep increase in anthropogenic CO2 emissions, and in some locations even the Little Ice Age temperatures (1400s to 1800s AD) were warmer than modern.  Finally, these 50 graphs clearly show that (c) the conceptualization of global-scale warming, or a globally synchronous rise in temperatures for the vast majority of the Earth’s land and oceanic locations in modern times . . . is not scientifically supportable.


In many parts of the world, today’s temperatures are still among the coldest they’ve been in the last several thousand years according to these graphs.   Sea levels, in turn, are at some of the lowest levels of the last 8,000 years; relative sea levels were 1 to 4 meters higher than they are now just a few thousand years ago.  Where warming has occurred, it’s been modest and slight, not rapid and dangerous.  Perhaps this is why  the “hide the decline” phenomenon became so necessary for hockey stick-favoring reconstructionists.


But perhaps advocates of rapid and dangerous global warming caused by humans need not worry about this lack of scientific support for modern hemispheric- and global-scale hockey sticks.  Because although scientists have revealed that many locations around the world have not been warming, there are other parts of the ocean and surface that indeed have been warming.  And that warming, yes that warming, in those locations, could be said to have been caused by humans.


————————————————————————————————————

See the 50 proxies and more \at: http://notrickszone.com/2016/09/27/hide-the-decline-unveiled-50-non-hockey-stick-graphs-quash-modern-global-warming-claims/#sthash.pII1b4zX.R7WlZMNp.dpuf