Debunking the Climate Scam
Billions of Dollars -
Greedy Green Corporations -
No Warming For Two decades -
Bought and Paid For Organizations
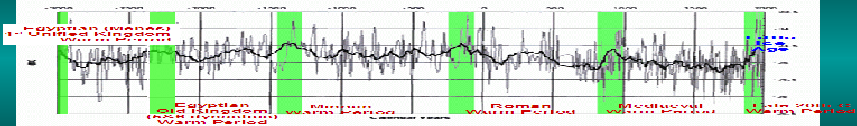
5000 Years Of Climate Change From Greenland Ice Cores
An Example Of Data Adjustments Adding Serious Warming
In The Official USHCN kept by the US Government
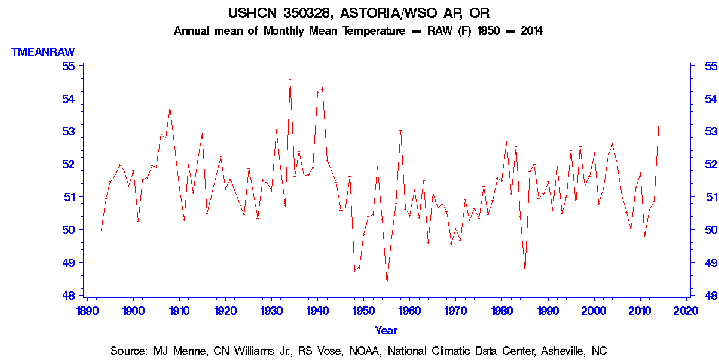
The Raw Data:
Here is a plot of the 122 year Astoria Oregon USHCN raw annual mean temperature time series from 1893 through 2014:
1) http://www.atmos.washington.edu/marka/kast.raw.tmean.gif
A Needed adjustment:
From 1953 forward the record is from the Astoria Airport with readings at midnight. Prior to 1953 the record is from downtown Astoria with time of observation at 5 PM.
The mean temperature at Astoria downtown from 1892-
Mean temperature Astoria downtown (1892-
Mean temperature Astoria Airport (1953-
Taking into account the differing times of observation, we find the mean temperatures are nearly identical at the two locations separated by about 2 miles.
Since 5 PM observations are biased warm, a time-
2) http://www.atmos.washington.edu/marka/kast.tobs.tmean.gif

The Official Record Becomes Large Warming!
Graph 2) (above) shows 1934 as the warmest year in the historical record at Astoria
with 2014 coming in as the 4th or 5th warmest year. But then further adjustments
were applied to further cool the data prior to 1953 by a whopping -
3) Â http://www.atmos.washington.edu/marka/kast.adjusted.tmean.gif

After this large adjustment 2014 becomes by far the warmest month at Astoria in the
past 122 years. The adjustment of -
To aid your visualization, here is a loop over the 3 versions of the 122-
http://www.atmos.washington.edu/~ovens/wxloop.cgi?/home/disk/user_www/marka/astoria+all
So the question of the day is why was this large cooling adjustment applied to the Astoria data prior to 1953?
(Text and graphs thanks to Mark Albright, Dept of Atmospheric Sciences, University
of Washington with minor edits by Webmaster)
| Warming Stopped |
| NOAA Data |
| NorthWest |
| Oregon |
| Washington |
| Extreme Weather |
| Past Was Warmer |
| NASA: 30's Hotter |
| HistoryOFAlarmism |
| Central England |
| Temperature History |
| MultiProxy |
| treemometers |
| Northwest Passage |
| Acidification-Ball |
| Acidification-Fulks |
| Acidification-Idso |
| Selected Emails |
| CRU Emails - html formatted |
| CRU Emails Simple Format |
| CRU Emails UnFormatted |
| DCPS paper |
| CRU_Files_Notice |
| False Deadlines |
| Hockey Stick Links |