Debunking the Climate Scam
Billions of Dollars -
Greedy Green Corporations -
No Warming For Two decades -
Bought and Paid For Organizations
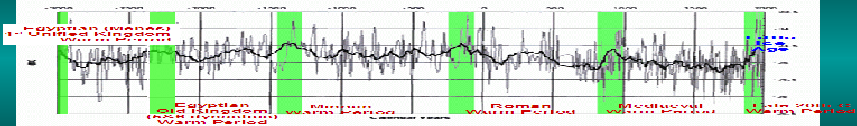
5000 Years Of Climate Change From Greenland Ice Cores
We Do Not Have Enough Data to Make Claims About Climate
Data problems:
* Lack of coverage in Africa, Oceans-
* Constant adjustments show the data is crap -
* Lack of history. Very little coverage before 1950;
Our data is not up to making judgements.
* Our ONLY world wide coverage is satellites and they only go back to 1979. Therefore there is not enough history to make long term judgements about world, which has cycles lasting decades, centuries and millennia .
* Radiosones go back further, but not back to the last warm spell, the 1930s, so we cannot make useful comparisons to the last really warm period, let alone the early 1900s and late 1800s.
* NOAA data (and its many derivatives) are unreliable because they have to constantly
revise them. Which is the correct climate history? The one from a few years ago that
showed 1930s to be warmer than 1998? Or the one that shows 1998 to be warmer? Can
we choose the latest one? NO -
* Ocean data is vertically non-
* Surface data suffers from station moves, time of observation changes, constant revisions, and changes in surrounding land use. Most (90%) are rated below top quality with errors of 1 degree or worse. The ONLY good surface data is USCRN which shows ZERO warming over its short span. World coverage is quite poor outside of the developed countries and arctic and even worse before about 1950. Many stations have been dropped from the official reports and estimates substituted.
Then one must add things like "hiding the decline"(Jones-
This pretty much sums up the whole field of climate research:
"there have been a number of dishonest presentations of model results by individual
authors and by IPCC. (Wigley-
Can we really know how much (if any) the climate has warmed during the instrument record? And how can we be confident it is correct?
More: https://alarmistclaimresearch.files.wordpress.com/2022/05/surface-
A Critical Review of Global Surface Temperature Data Products
Ross McKitrick, University of Guelph -
Abstract
There are three main global temperature histories: the combined CRU-
The number of weather stations providing data to GHCN plunged in 1990 and again in
2005. The sample size has fallen by over 75% from its peak in the early 1970s, and
is now smaller than at any time since 1919. The collapse in sample size has increased
the relative fraction of data coming from airports to about 50 percent (up from about
30 percent in the 1970s). It has also reduced the average latitude of source data
and removed relatively more high-
Oceanic data are based on sea surface temperature (SST) rather than marine air temperature
(MAT). All three global products rely on SST series derived from the ICOADS archive.
ICOADS observations were primarily obtained from ships that voluntarily monitored
SST. Prior to the post-
The quality of data over land, namely the raw temperature data in GHCN, depends on
the validity of adjustments for known problems due to urbanization and land-
The overall conclusion of this report is that there are serious quality problems
in the surface temperature data sets that call into question whether the global temperature
history, especially over land, can be considered both continuous and precise. Users
should be aware of these limitations, especially in policy-
https://papers.ssrn.com/sol3/papers.cfm?abstract_id=1653928
PDF: https://papers.ssrn.com/sol3/Delivery.cfm/SSRN_ID1653928_code237317.pdf?abstractid=1653928&mirid=1
| Warming Stopped |
| NOAA Data |
| NorthWest |
| Oregon |
| Washington |
| Extreme Weather |
| Past Was Warmer |
| NASA: 30's Hotter |
| HistoryOFAlarmism |
| Central England |
| Temperature History |
| MultiProxy |
| treemometers |
| Northwest Passage |
| Acidification-Ball |
| Acidification-Fulks |
| Acidification-Idso |
| Selected Emails |
| CRU Emails - html formatted |
| CRU Emails Simple Format |
| CRU Emails UnFormatted |
| DCPS paper |
| CRU_Files_Notice |
| False Deadlines |
| Hockey Stick Links |