Debunking the Climate Scam
Billions of Dollars -
Greedy Green Corporations -
No Warming For Two decades -
Bought and Paid For Organizations

5000 Years Of Climate Change From Greenland Ice Cores

Cities such as New York, Philadelphia, and Boston are prominent centers of political power. Less known: Their size, background ecology, and development patterns also combine to make them unusually warm, according to NASA scientists who presented new research recently at an American Geophysical Union (AGU) meeting in San Francisco, Calif.
Summer land surface temperature of cities in the Northeast were an average of 7 °C to 9 °C (13°F to 16 °F) warmer than surrounding rural areas over a three year period, the new research shows. The complex phenomenon that drives up temperatures is called the urban heat island effect.
AGU meeting.

By comparing 42 cities in the Northeast, they found that densely-
The compact city of Providence, R.I., for example, has surface temperatures that
are about 12.2 °C (21.9 °F) warmer than the surrounding countryside, while similarly-
She found that land cover maps show that about 83 percent of Providence is very or
moderately densely-
Cities in desert regions, such as Las Vegas, in contrast, often have weak heat islands or are actually cooler than the surrounding rural area. Providence, R.I.; Washington, D.C.; Philadelphia, Pa.; Baltimore, Md.; Boston, Ma.; and Pittsburgh, Pa.; had some of the strongest heat islands of the 42 northeastern cities analyzed.
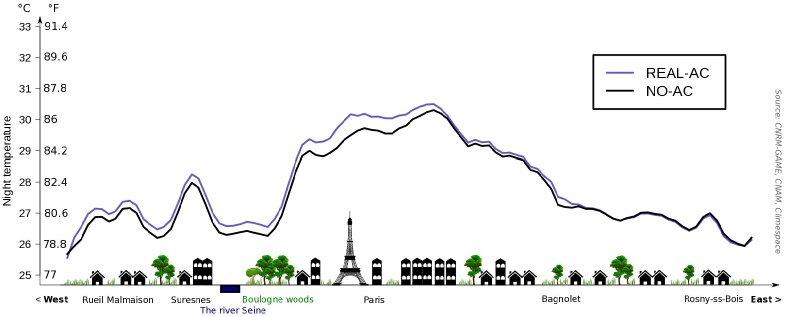
This graph shows the result of a model that calculated the likely magnitude of the effect during the 2003 heat wave in Paris
| Warming Stopped |
| NOAA Data |
| NorthWest |
| Oregon |
| Washington |
| Extreme Weather |
| Past Was Warmer |
| NASA: 30's Hotter |
| PastBeliefs |
| HistoryOFAlarmism |
| Central England |
| Temperature History |
| MultiProxy |
| treemometers |
| Northwest Passage |
| Acidification-Ball |
| Acidification-Fulks |
| Acidification-Idso |
| Selected Emails |
| CRU Emails - html formatted |
| CRU Emails Simple Format |
| CRU Emails UnFormatted |
| DCPS paper |
| CRU_Files_Notice |
| False Deadlines |
| Hockey Stick Links |