Debunking the Climate Scam
Billions of Dollars -
Greedy Green Corporations -
No Warming For Two decades -
Bought and Paid For Organizations
5000 Years Of Climate Change From Greenland Ice Cores


Fig 4. Except for the well known fact that temperature changes precede CO2 changes,
the supposed CO2-
Thanks to http://icecap.us/index.php/go/in-
CO2 & Climate
Ice cores refer a core (like an apple core) that usually extends from the surface to thousands of feet down in ice, either in a glacier or polar ice cap. By analyzing the CO2 content and an isotope of Oxygen, scientists deduce the temperature and the CO2 levels at various depths which were deposited over the ages.
When it was found that CO2 and temperature changed together over history, some jumped to the conclusion that CO2 changes caused temperature changes.
However, as better methods of analysis were developed, it became apparent that the temperature changed first and only after an average of 800 years did CO2 change. Since a cause cannot occur before the effect, this proves that CO2 did not cause the temperature changes.
Next it was claimed that “something unknown” initiated the temperature increase, then CO2 caused it to continue. The problem here is that, at the peak, the temperature reverses, while the CO2 remains high. The below graph shows this situation. Read the whole paper here. Vostok data is here
Realclimate.org/index.php?p=13:
This is an issue that is often misunderstood in the public sphere and media, so it is worth spending some time to explain it and clarify it. At least three careful ice core studies have shown that CO2 starts to rise about 800 years (600_1000 years) after Antarctic temperature during glacial terminations. These terminations are pronounced warming periods that mark the ends of the ice ages that happen every 100,000 years or so.
Does this prove that CO2 doesn't cause global warming? The answer is no.
The reason has to do with the fact that the warmings take about 5000 years to be complete. The lag is only 800 years. All that the lag shows is that CO2 did not cause the first 800 years of warming, out of the 5000 year trend. The other 4200 years of warming could in fact have been caused by CO2, as far as we can tell from this ice core data. (bold added)
(Did you notice the twisted logic to try to pin the blame on CO2? After admitting CO2 did not start the warming at the end of ice ages, they say CO2 “could” have caused it to continue! Of course the cause of the original warming could simply have continued.)
Some points:
1. They admit that CO2 did not cause warming: CO2 starts to rise about 800 years (600_1000 years) after Antarctic temperature
2. The only other relevant statement is: The other 4200 years of warming could in fact have been caused by CO2
Notice the qualifier “could have ... been”? That means they can’t prove it, and are just speculating. Another possibility is that continued warming was caused by whatever started the initial warming simply continuing. Which is most rational?
Here is what the web site created to support the “hockey stick” said
Peer-
(Thanks to Andrew at Z4, an excellent resource.)
Atmospheric CO2 Concentrations over the Last Glacial Termination
(Science, Vol. 291. no. 5501, 5 January 2001)
-
Ice core records of atmospheric CO2 around the last three glacial terminations
(Science, Vol. 283. no. 5408, pp. 1712 -
-
QUOTE: High-
Southern Hemisphere and Deep-
(Science, September 27, 2007)
-
QUOTE: Deep sea temperatures warmed by ~2C between 19 and 17 ka B.P. (thousand years before present), leading the rise in atmospheric CO2 and tropical surface ocean warming by ~1000 years.
(Quaternary Science Reviews, Volume 20, Issue 4, Pages 583-
-
QUOTE: Over the full 420 ka of the Vostok record, CO2 variations lag behind atmospheric temperature changes in the Southern Hemisphere by 1.3±1.0 ka
Timing of Atmospheric CO2 and Antarctic Temperature Changes Across Termination III
(Science 14, Vol. 299. no. 5613, March 2003)
-
QUOTE: The sequence of events during Termination III suggests that the CO2 increase lagged Antarctic deglacial warming by 800 ± 200 years and preceded the Northern Hemisphere deglaciation.
Citations from http://wattsupwiththat.com/2014/12/27/vostok-
[1] J. R. Petit*, J. Jouzel†, D. Raynaud*, N. I. Barkov‡, J.-
[2] Jo Nova: The 800 year lag – graphed
[3] Lisiecki & Raymo (2005) A Pliocene-
[4] Energy Matters: The Carbon Cycle: a geologist’s view
Here is a full set of the graphs with links to the actual data
Here is a graph from the National Climate Data center showing CO2 lags temperature
This chart from the National Climate Data center page on CO2 & temperature shows temperature in blue and CO2 in Red. The accompanying text ignores the fact that the blue (temperature) plainly changes before the red (CO2). Especially on the downside, but visible on most increases as a sliver of blue to the left of the red. Click to see larger at the US government source.

| Warming Stopped |
| NOAA Data |
| NorthWest |
| Oregon |
| Washington |
| Extreme Weather |
| Past Was Warmer |
| NASA: 30's Hotter |
| PastBeliefs |
| HistoryOFAlarmism |
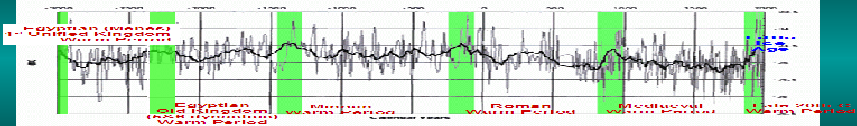
| Central England |
| Temperature History |
| MultiProxy |
| treemometers |
| Northwest Passage |
| Acidification-Ball |
| Acidification-Fulks |
| Acidification-Idso |
| Selected Emails |
| CRU Emails - html formatted |
| CRU Emails Simple Format |
| CRU Emails UnFormatted |
| DCPS paper |
| CRU_Files_Notice |
| False Deadlines |
| Hockey Stick Links |